基因表达差异分析(无生物学)

使用方法
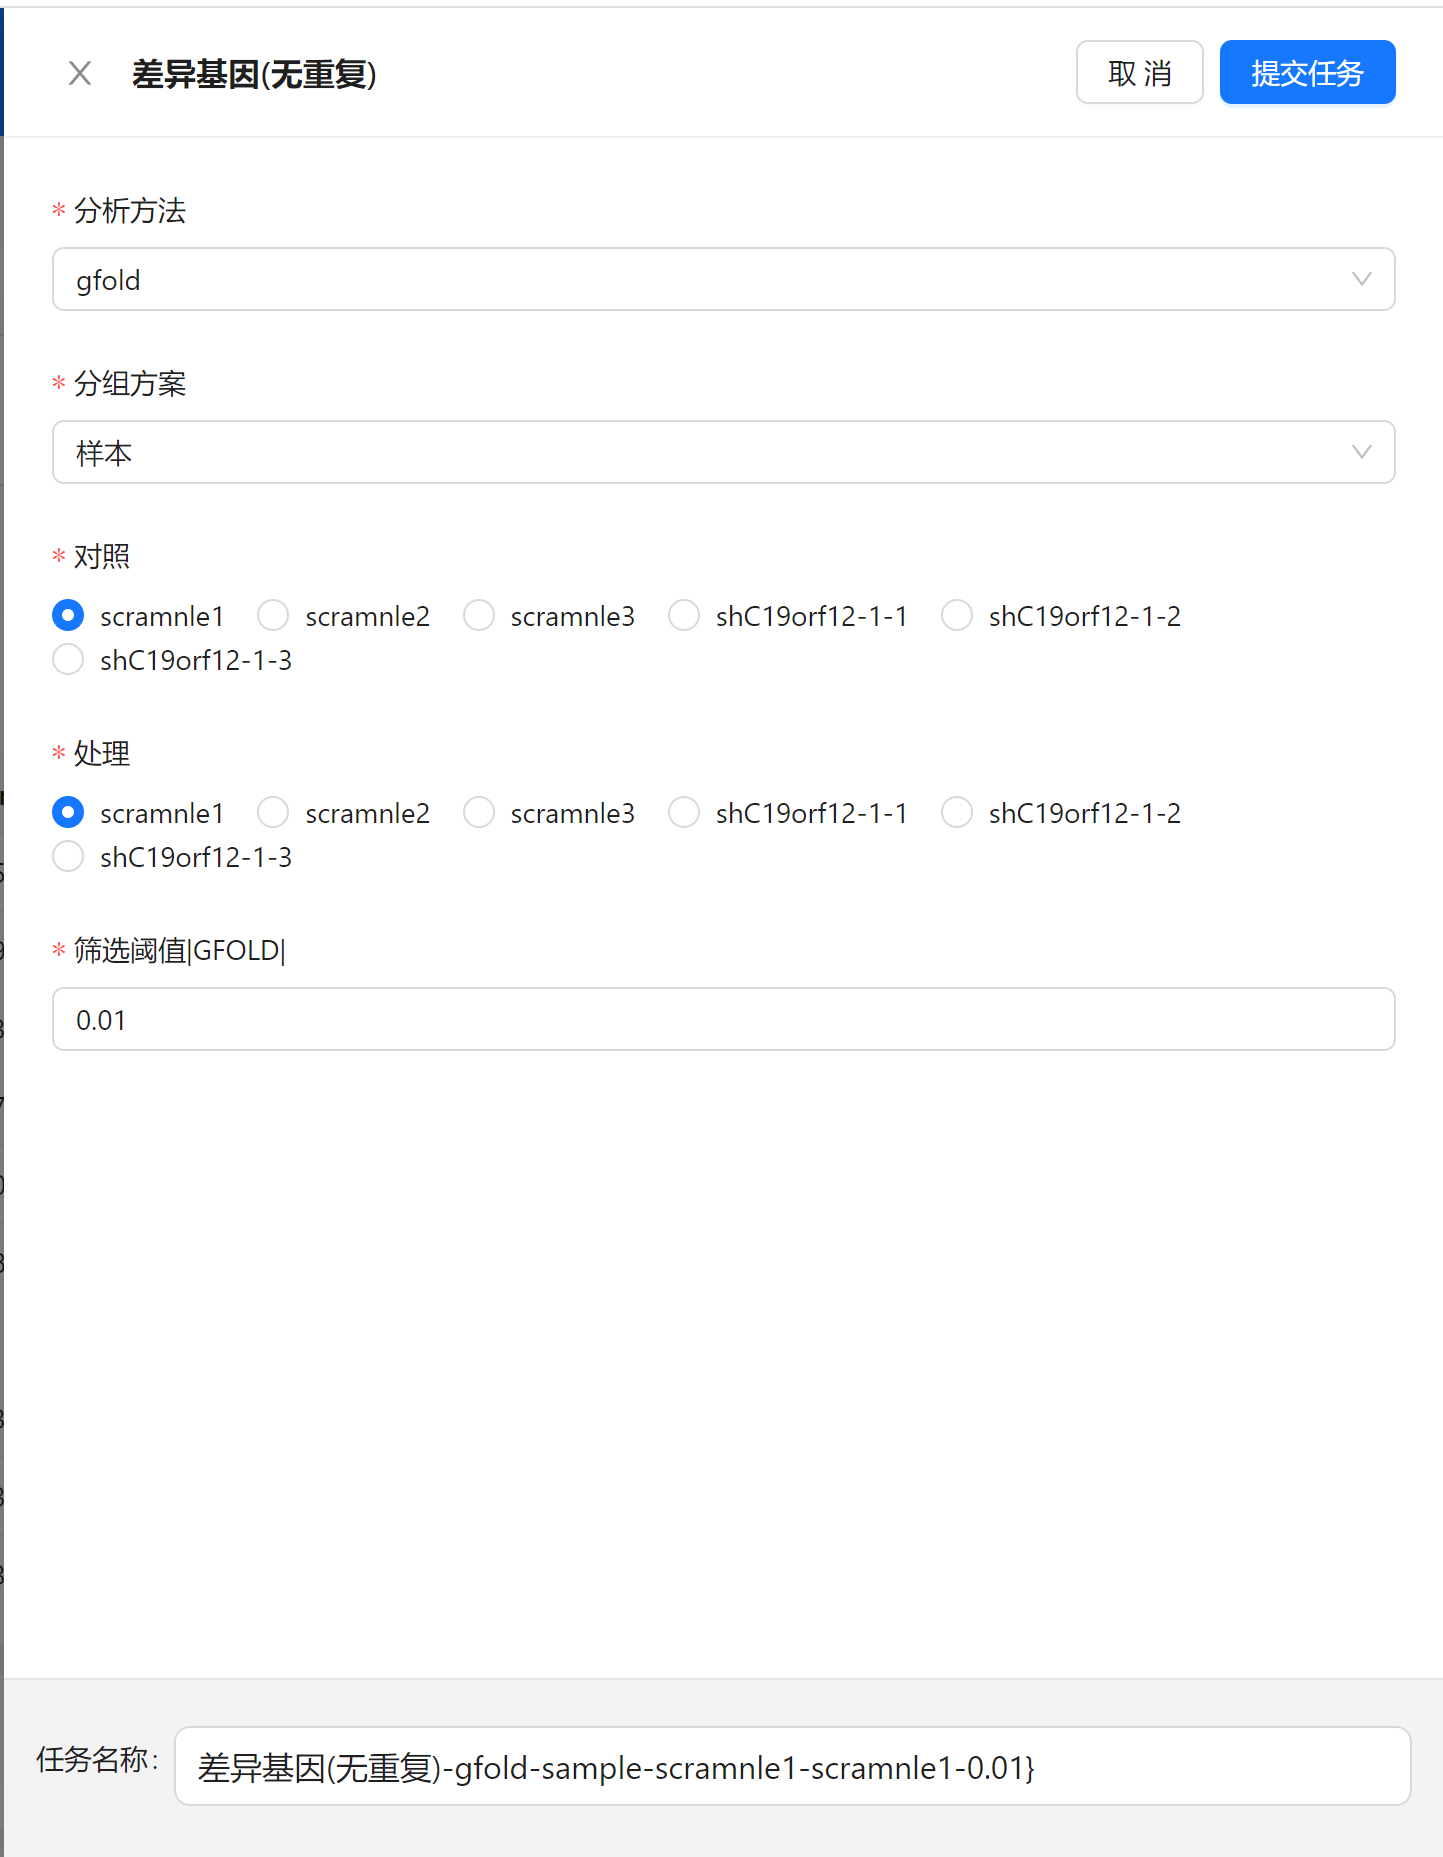
在数据分析页面点击“差异基因(无重复)”工具,分析方法选gfold,分组方案为样本,然后设置对照组和处理组,点击开始分析。
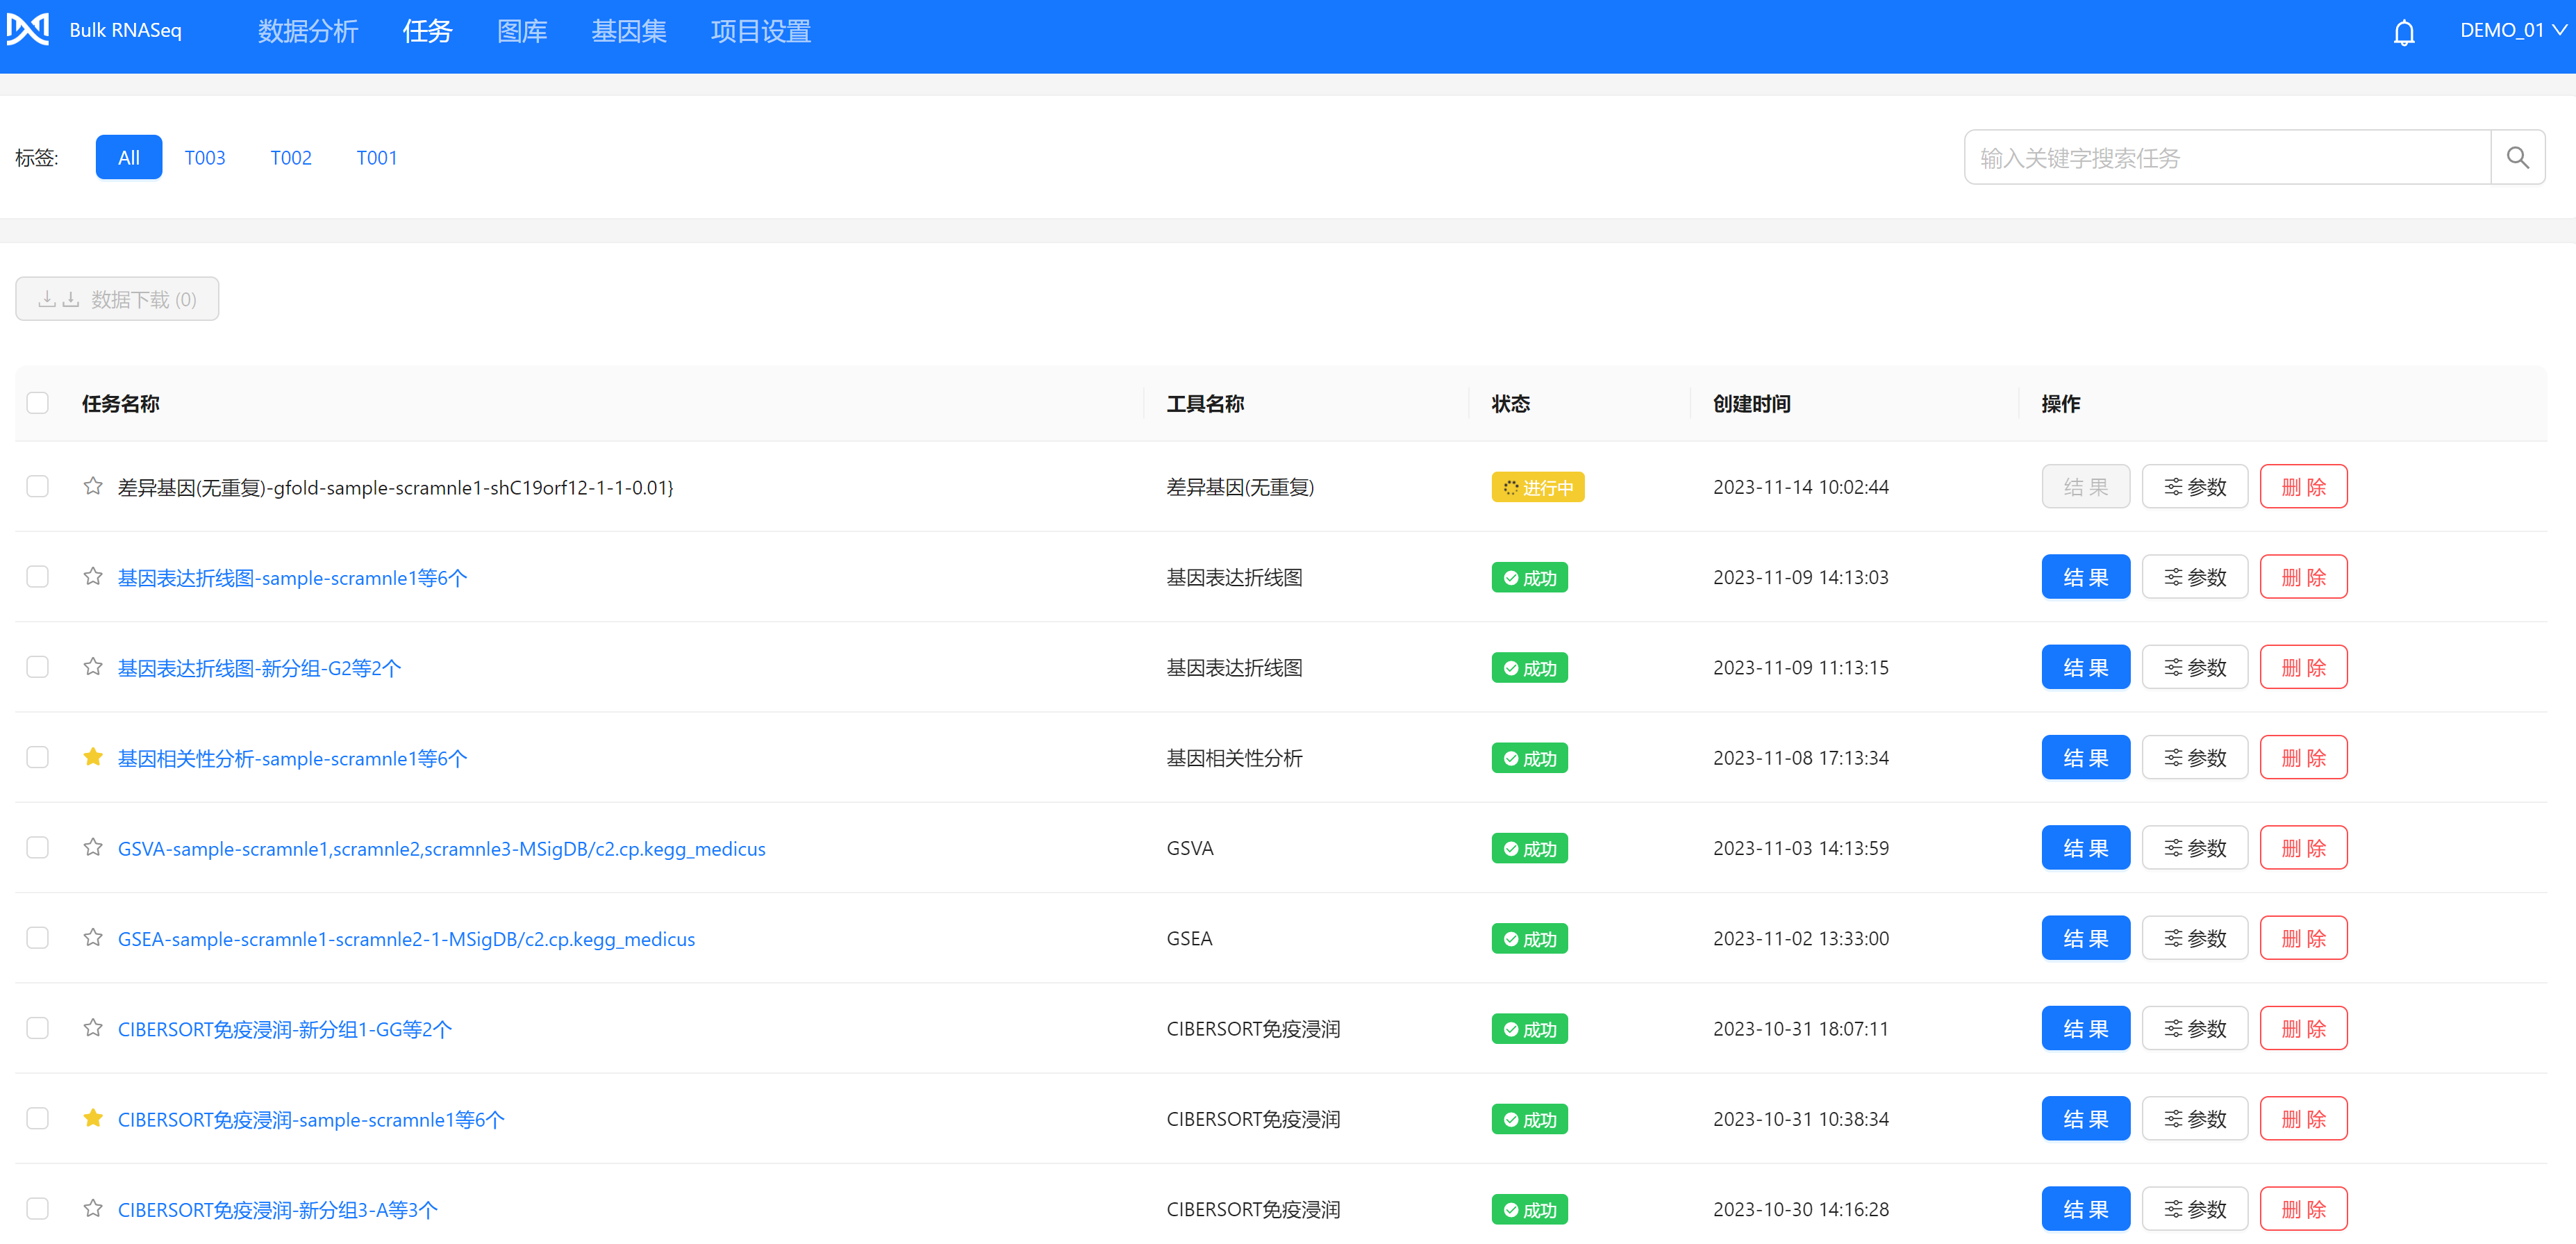
点击提交任务以后,可以去任务栏查看分析进展,待分析完成以后可查看结果
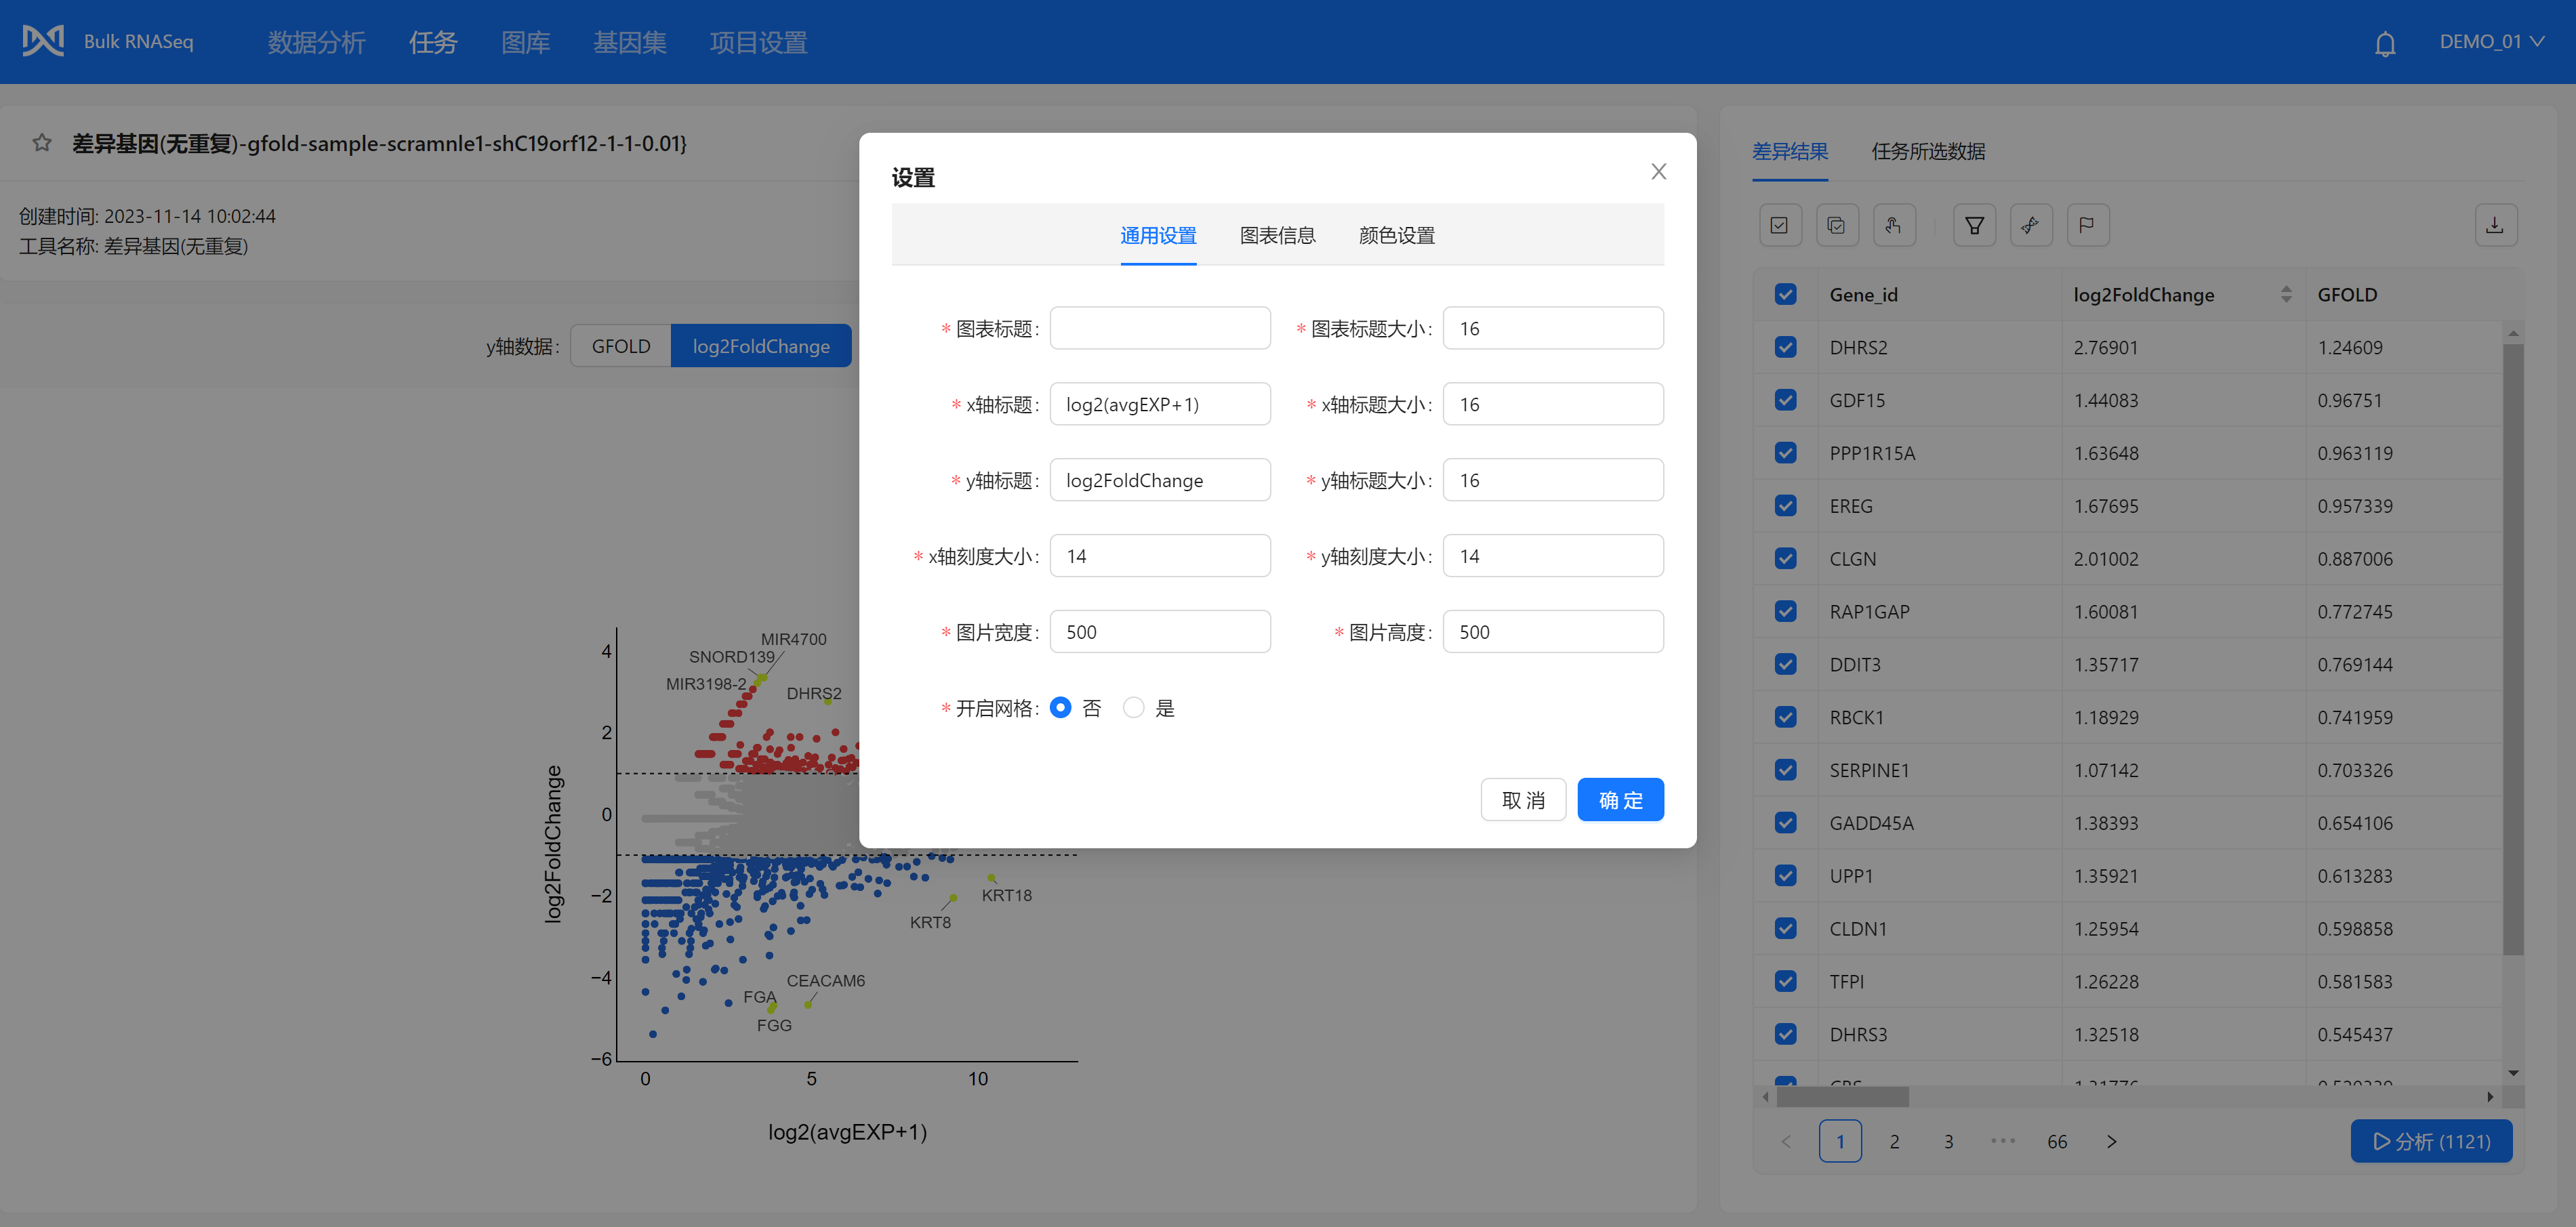
点击查看,可进入结果页面,查看差异分析结果表格与图片,也可以根据自己喜好对图片进行个性化调整
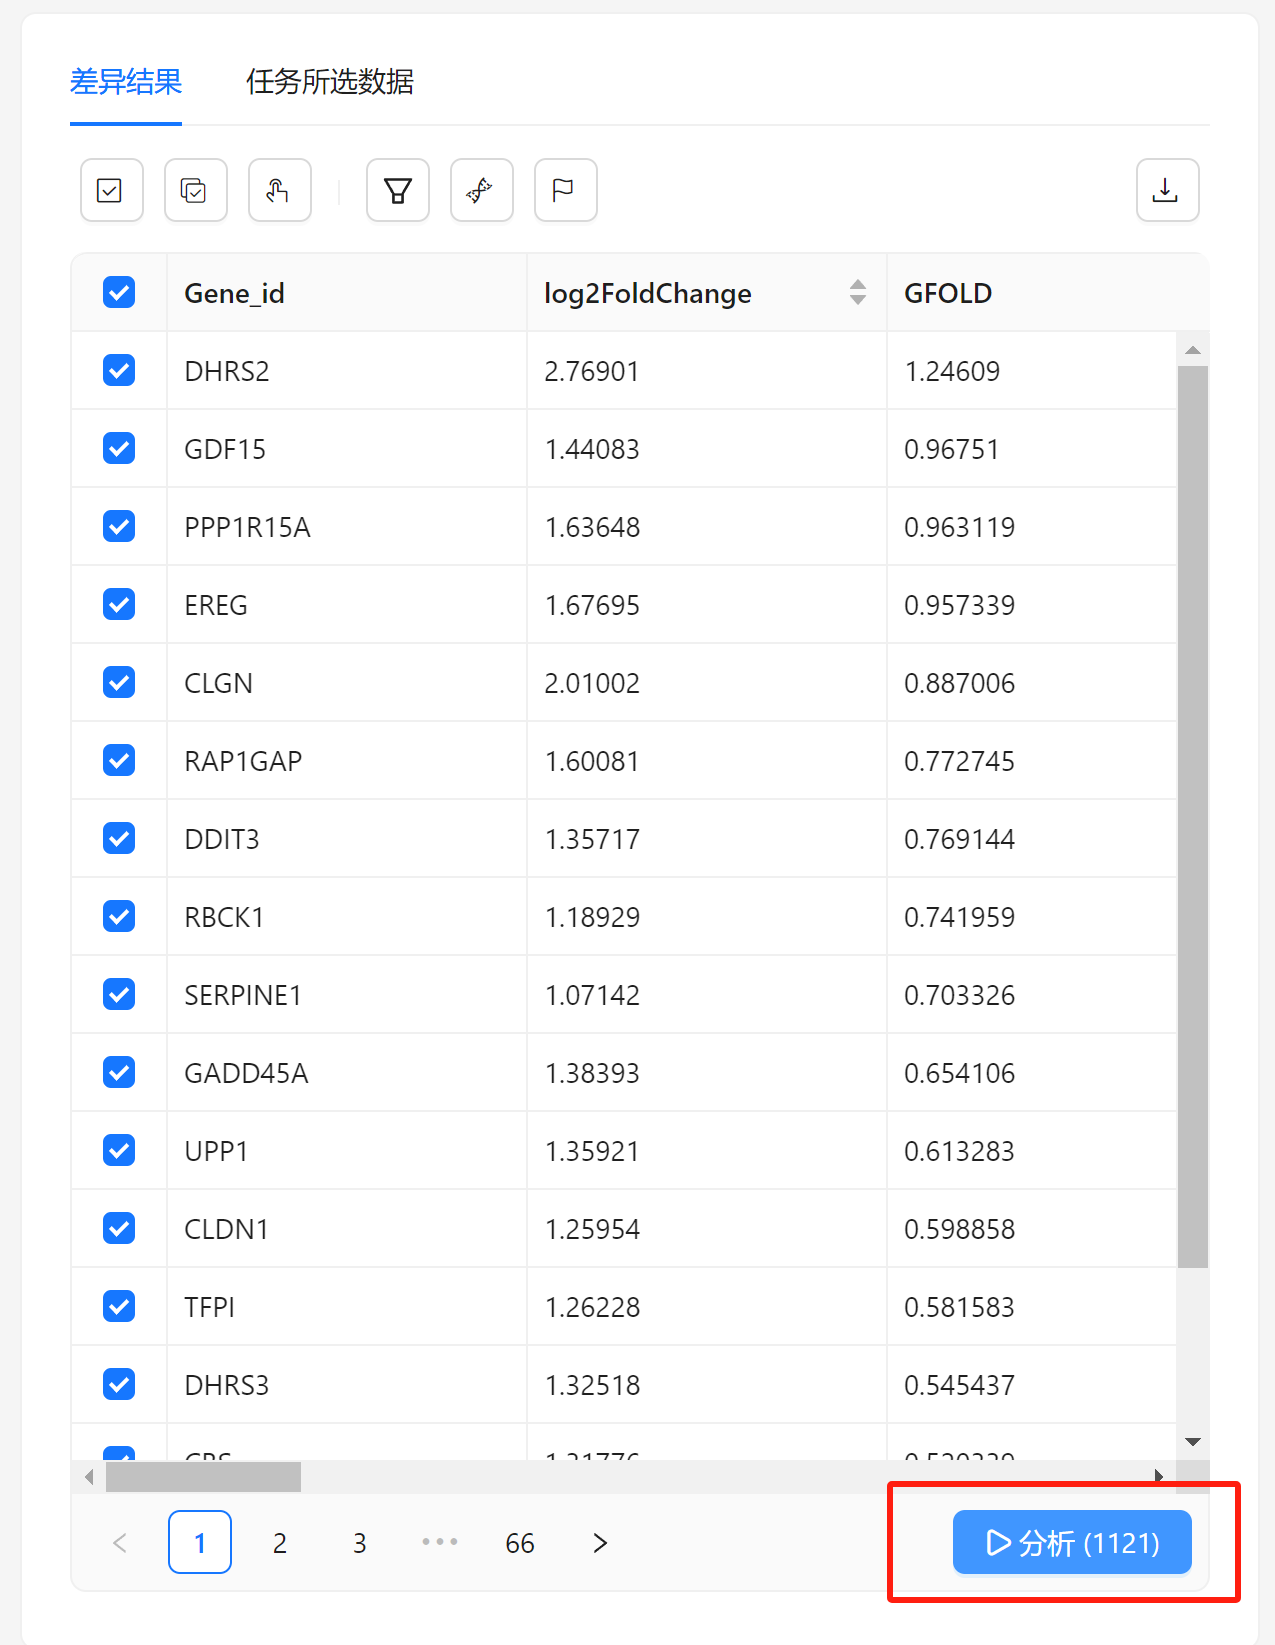
点击差异结果表格右下角开始分析可以对差异基因进一步分析,例如富集分析,蛋白互作等等。详情见后续工具介绍~
软件和版本
gfold V1.1.4
分析参数
默认分析参数,筛选阈值GFOLD绝对值大于等于0.01,可自己在分析参数和结果页面进行设置
参考文献:
Jianxing Feng, Clifford A. Meyer, Qian Wang, Jun S. Liu, X. Shirley Liu, Yong Zhang, GFOLD: a generalized fold change for ranking differentially expressed genes from RNA-seq data, Bioinformatics, Volume 28, Issue 21, November 2012, Pages 2782–2788, https://doi.org/10.1093/bioinformatics/bts515
引用方式
Method
XXX(分析名称) analysis were performed by using xxx(工具名称) tools in EAnalyse (https://bulk.eanalyse.cn/), a comprehensive web service for biomedical data analysis and visualization.
Acknowledgement
We thank Chengdu Eanalyse Biotechnology Co., Ltd. for developing EAnalyse platform (https://bulk.eanalyse.cn/) and providing technical assistance and valuable tools for data analysis and visualization.